There are no items in your cart
Add More
Add More
| Item Details | Price | ||
|---|---|---|---|

{{DATE}}
The landscape of Indian financial certification underwent a seismic shift in January 2026. For years, the NISM Series XV: Research Analyst exam was often perceived as a hurdle of rote memorisation - a test of who could remember the most definitions. That era is over.
The 2026 update has transformed this certification into a high-stakes simulation of the real-world research desk. With the syllabus expanding from 13 to 15 chapters - incorporating deep-dives into Technical Analysis and Commodities - the regulator has sent a clear message: A Research Analyst must be a polymath, equally comfortable with a balance sheet, a candlestick chart, and a tax code.
The most formidable barrier in the new format is the 20-mark Case Study mandate. You are no longer just answering questions; you are "diagnosing" companies across five multi-layered scenarios. Whether you are an aspiring analyst looking to break into a top-tier brokerage or a seasoned professional needing to recertify, the "old" shortcuts will fail you.
This masterclass is designed to be your definitive survival guide. We have deconstructed the entire 2026 syllabus into 12 Critical Pillars, ranging from the mathematical precision of Enterprise Value to the psychological volatility of Herd Mentality. This isn't just about passing a test; it’s about building the professional competence required to navigate the markets of 2026 and beyond.
Pillar 1: The Psychology of the Floor - Support Level Breaches
The Core Question: “According to Technical Analysis, if the price of a stock breaks below an important support level, what is the most likely outcome?”
1.1 Defining the "Wall of Buy Orders"In the trenches of technical analysis, a Support Level is not just a line on a chart; it is a psychological battleground. It represents a price point where the consensus of value among market participants shifts. At this level, the "demand" (buyers) is perceived to be strong enough to interrupt a downward trend.
Imagine a stock falling from ₹500 to ₹450. If, historically, big institutional players have decided that ₹450 is "cheap," they will place massive buy orders at that level. This creates a "floor." Every time the price hits ₹450, it bounces back because the supply of stock for sale is completely absorbed by this wall of demand.
1.2 The Anatomy of a Breach. A breach occurs when the narrative shifts. Perhaps a negative earnings report drops, or the sector enters a cyclical downturn. Suddenly, the buyers at ₹450 are no longer confident. They pull their orders. Simultaneously, the sellers (Bears) become aggressive. When the price slips to ₹449.50, the "floor" has officially cracked. In technical analysis, we call this a Breakdown. This isn't just a numerical change; it’s a signal that the market's "fair value" perception has moved lower.
1.3 The "Principle of Polarity" This is a critical concept for NISM XV case studies. Once a support level is broken, its role reverses. The "Floor" becomes the "Ceiling." Why? Because all those traders who bought at ₹450 (the old support) are now in a loss. As soon as the price bounces back to ₹450, they want to sell to "break even." This creates a new Resistance Level.
The Analyst’s Verdict: If a stock breaks an important support, the path of least resistance is downward. The price will almost certainly continue to decline until it encounters the Next Support Level, which is usually the next historical low or a significant "round number" psychological level.
Pillar 2: The Pressure Cooker - Descending Triangle Dynamics
The Core Question: “In a Descending Triangle chart pattern, how do the price lows typically behave?”
2.1 The Visual Setup. If chart patterns were emotions, the Descending Triangle would be "Relentless Pessimism." It is formed by two converging lines:
2.3 Behaviour of the Highs (Mounting Pressure)While the lows are stable, the Highs are falling. Every time the stock tries to rally, it fails earlier than it did the last time.
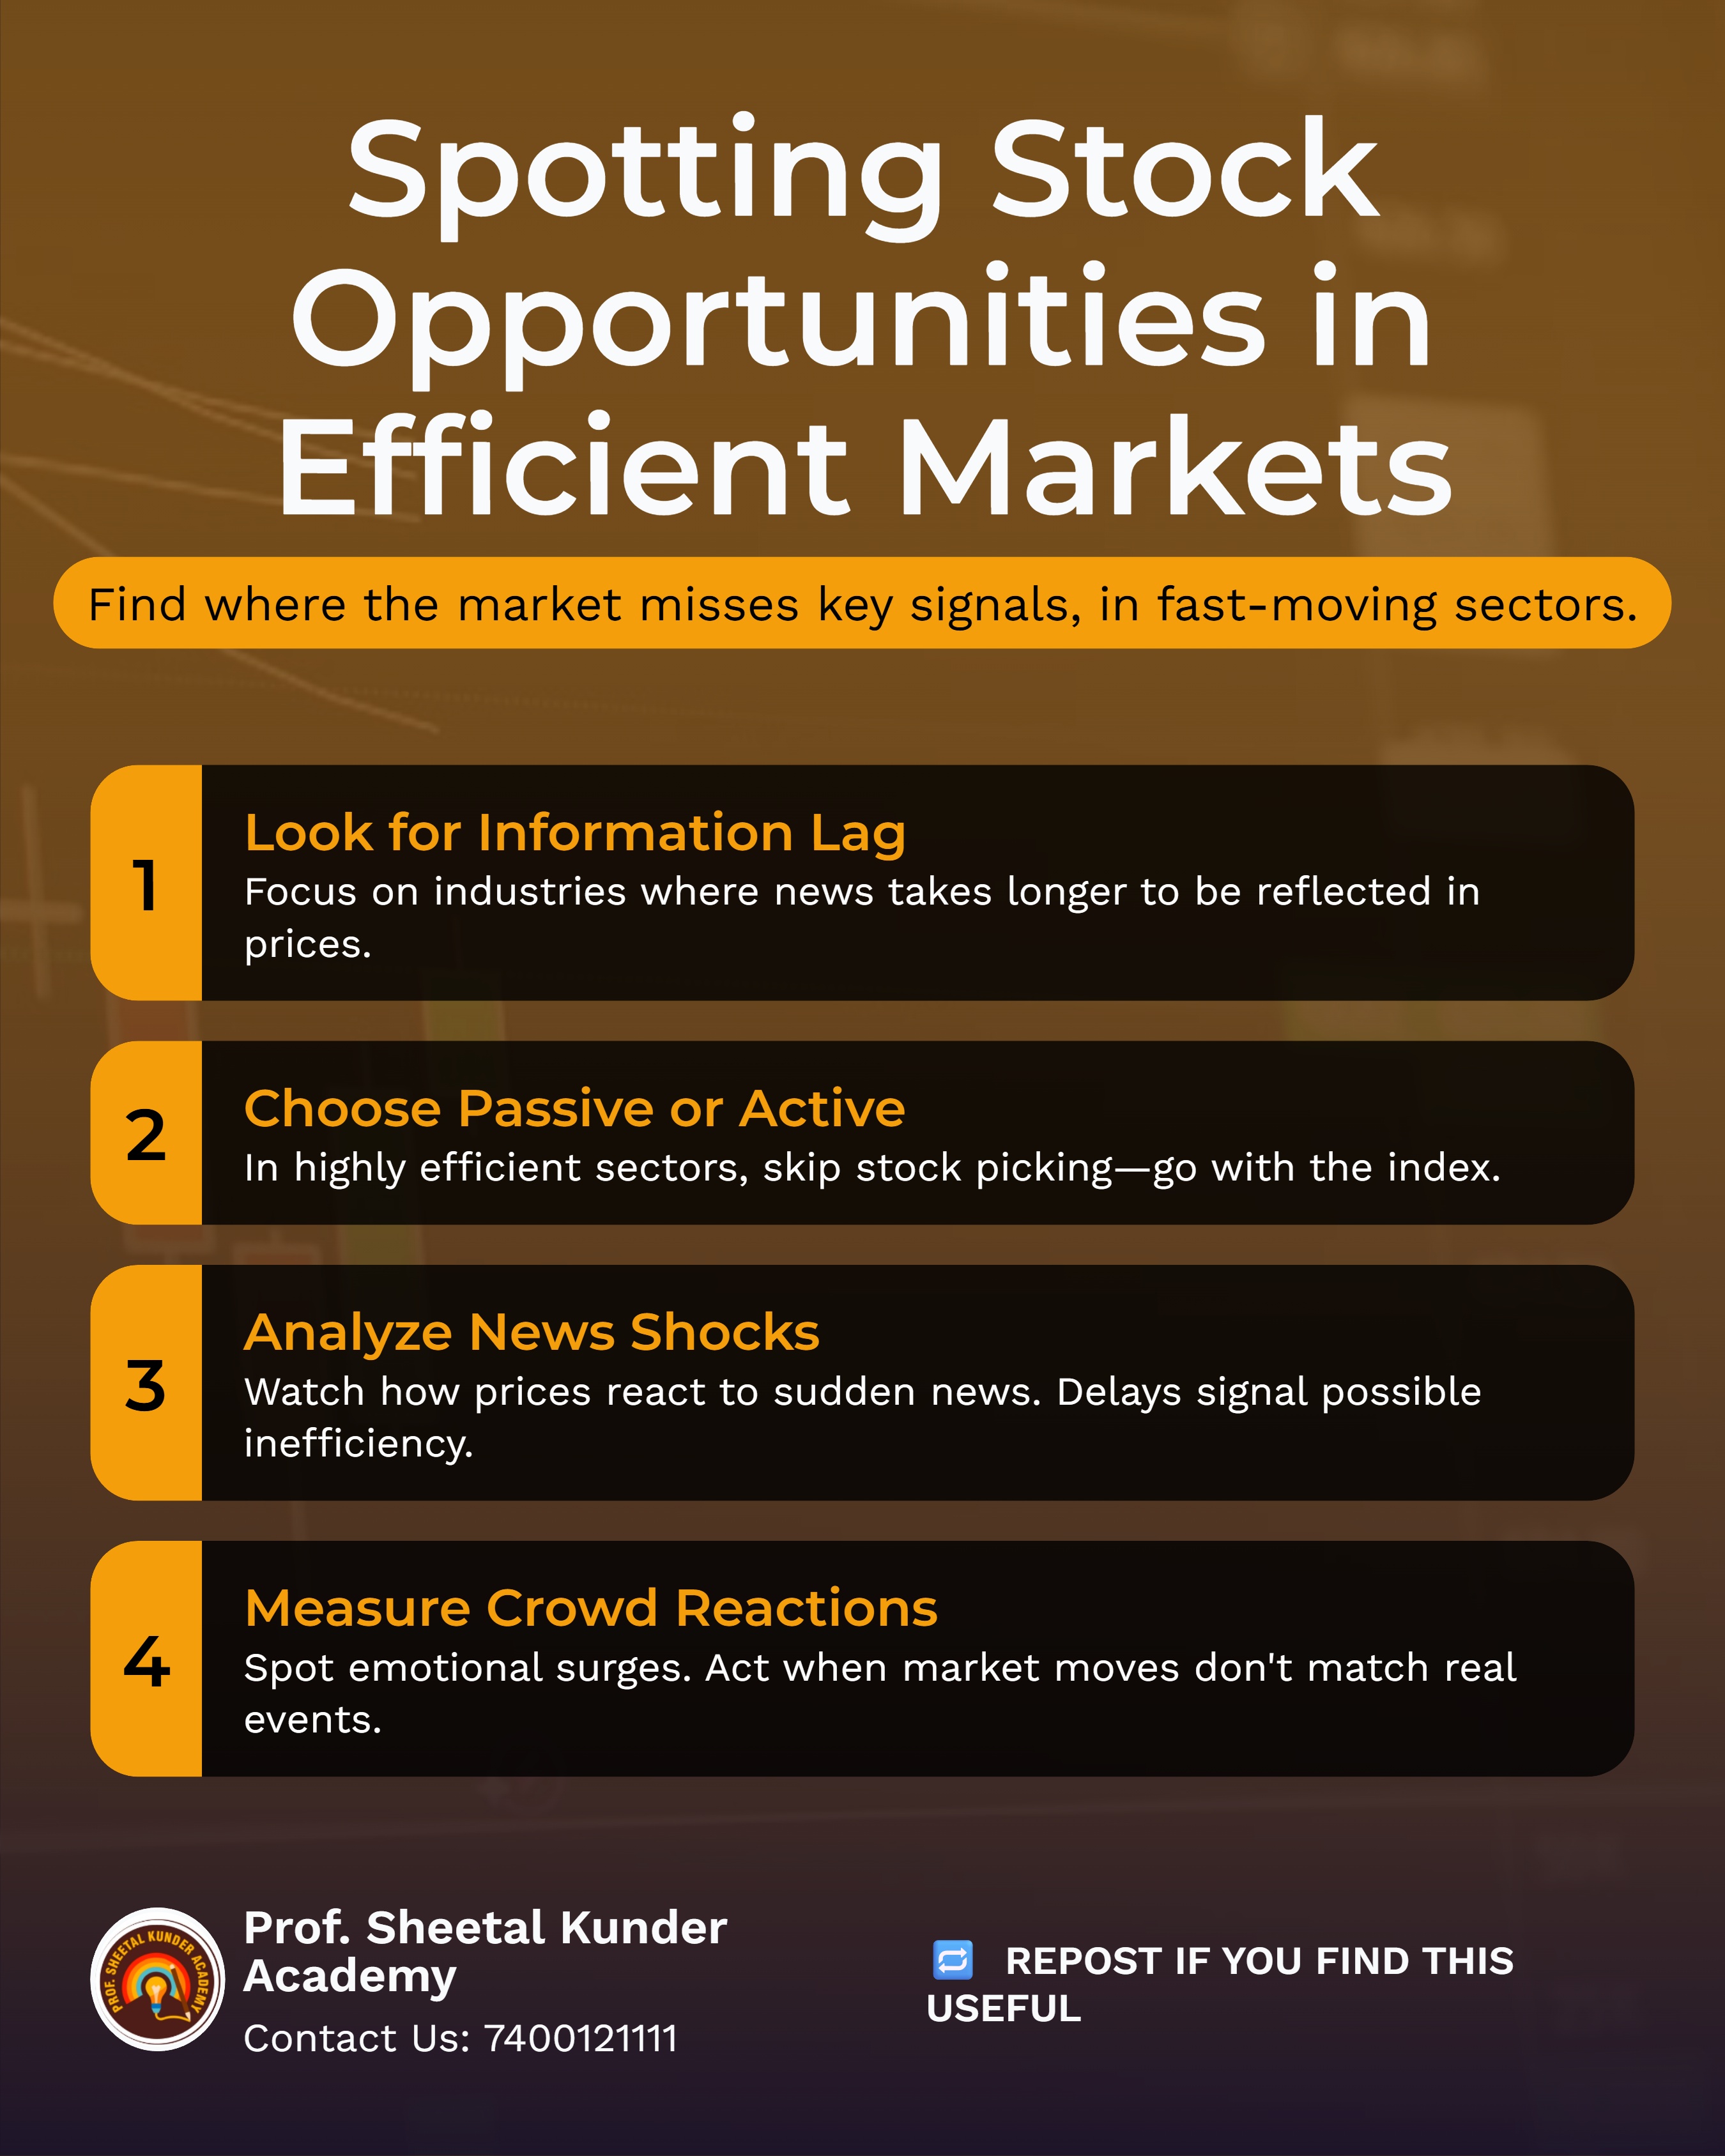
Pillar 3: The Omniscient Market - Efficient Market Hypothesis (EMH)
The Core Question: “The Efficient Market Hypothesis (EMH) proclaims that _________.”
3.1 The Theory of Perfection The EMH, popularised by Eugene Fama, is the "Nightmare Theory" for active stock pickers. It claims that the stock market is so efficient that share prices instantly incorporate and reflect all relevant information. Think of the market as a supercomputer. If a company wins a ₹1,000 Crore contract at 10:00 AM, the EMH predicts that by 10:00:01 AM, the stock price has already risen to reflect that profit. Therefore, you cannot buy the stock at 10:05 AM and expect to profit from the "news" - the profit is already "priced in."
3.2 The Three Forms of Efficiency. The exam often asks you to distinguish between these three:
Pillar 4: The Trend’s Pulse - ADX and DMI Interaction.
The Core Question: “In the context of the ADX, buy signals are generated based on the interaction of +DMI and -DMI. Which statement is correct?”
4.1 The ADX: Strength, Not Direction. The ADX (Average Directional Index) is a non-directional indicator. It tells you the "intensity" of the trend.
Pillar 5: Quantitative Mastery - Calculating Return on Equity (ROE)
The Core Question: “A company's asset-to-equity ratio is 2.5; total assets are ₹50,00,000; net income is ₹7,50,000. What is the ROE?”
5.1 The Logical Bridge. The NISM XV exam loves to give you "Variable A" and "Variable B" and expects you to derive "Variable C." Here, you cannot calculate ROE without finding Equity first.
Step 1: Decoding the Ratio. The Asset-to-Equity Ratio tells you how much the company owns vs. how much the shareholders put in.
5.2 The Analyst's Interpretation (The DuPont Lens). An ROE of 37.5% is exceptionally high. However, as an analyst, you must look at the Asset-to-Equity ratio of 2.5. This indicates Financial Leverage. The company has ₹2.50 of assets for every ₹1.00 of equity. This means they are using ₹1.50 of Debt.
High ROE is good, but if it's driven entirely by high debt (leverage), the company is risky. This is the level of depth required for the 20-mark Case Study section.
Pillar 6: Valuation Mastery - Determining Enterprise Value (EV)
The Core Question: “Paid-up capital: ₹36L (FV ₹6); EPS: ₹12; P/E Ratio: 18; Debt: ₹20L; Cash: ₹80L. Find the EV.”6.1 What is Enterprise Value? Think of EV as the "Takeover Price." If you want to buy a business entirely, you must:
6.2 The Step-by-Step Calculation
Pillar 7: The Safety Net - Interpreting Value at Risk (VaR)
The Core Question: “Identify the correct interpretation: The weekly VaR (5%) of a portfolio is ₹8 lakhs.”
7.1 The Math of Probability VaR is the primary tool for risk management in 2026. To interpret it, you must understand the Confidence Level. If the "Risk Probability" is 5%, then the "Confidence Level" is 95% ($100\% - 5\%$).
7.2 The Interpretation. The statement means: "We are 95% confident that our portfolio will not lose more than ₹8 Lakhs in a single week."
Alternatively: "There is only a 5% chance that the loss will exceed ₹8 Lakhs."7.3 Why It Matters. For a Research Analyst, VaR helps in "Stressing" a portfolio. If an investor says, "I cannot afford to lose more than ₹10 Lakhs," and your VaR calculation shows a potential loss of ₹15 Lakhs, you must rebalance the portfolio. Clearing corporations also use VaR to decide the Margin they collect from you. High volatility = High VaR = High Margin.
Pillar 8: The Psychological Trap - Herd Mentality & Social Proof
The Core Question: “Investors sometimes prefer to buy a stock only after seeing many other investors buying the same security, assuming that others might have better information. This behaviour is known as:”
8.1 The "Social Proof" Theory. In behavioural finance, Herd Mentality is the tendency of individuals to mimic the actions (rational or irrational) of a larger group. From an evolutionary standpoint, following the tribe meant survival; in the stock market, it often means the opposite.
This behaviour is driven by Social Proof. When an investor is uncertain about a stock, they look to the actions of others as a guide for correct behaviour. They operate under the assumption that "if everyone is buying, they must know something I don't." This creates a feedback loop: the more people buy, the higher the price goes, which attracts even more "sheep" to the herd.
8.2 The "Asymmetric Information" Fallacy. The Research Analyst exam probes why this happens. It is usually based on the belief that there is Information Asymmetry - the idea that institutional investors or "insiders" possess superior data. By the time the retail "herd" enters the stock, the information is usually already priced in (per EMH), and the stock is often at the peak of a bubble.
8.3 Case Study: The Dot-Com Bubble. To understand Herd Mentality, we look at the late 1990s. Investors piled into any company with a ".com" suffix, regardless of revenue or business model. Analysts who warned of overvaluation were ignored because the "herd" was making double-digit returns daily. The eventual crash happened when the supply of new "followers" dried up, leaving the last ones in the herd with worthless assets.
The Analyst’s Verdict: A successful Research Analyst must recognise Herd Mentality as a risk factor. When price movement is driven by "FOMO" (Fear Of Missing Out) rather than fundamental earnings growth, the stock is in a high-risk zone.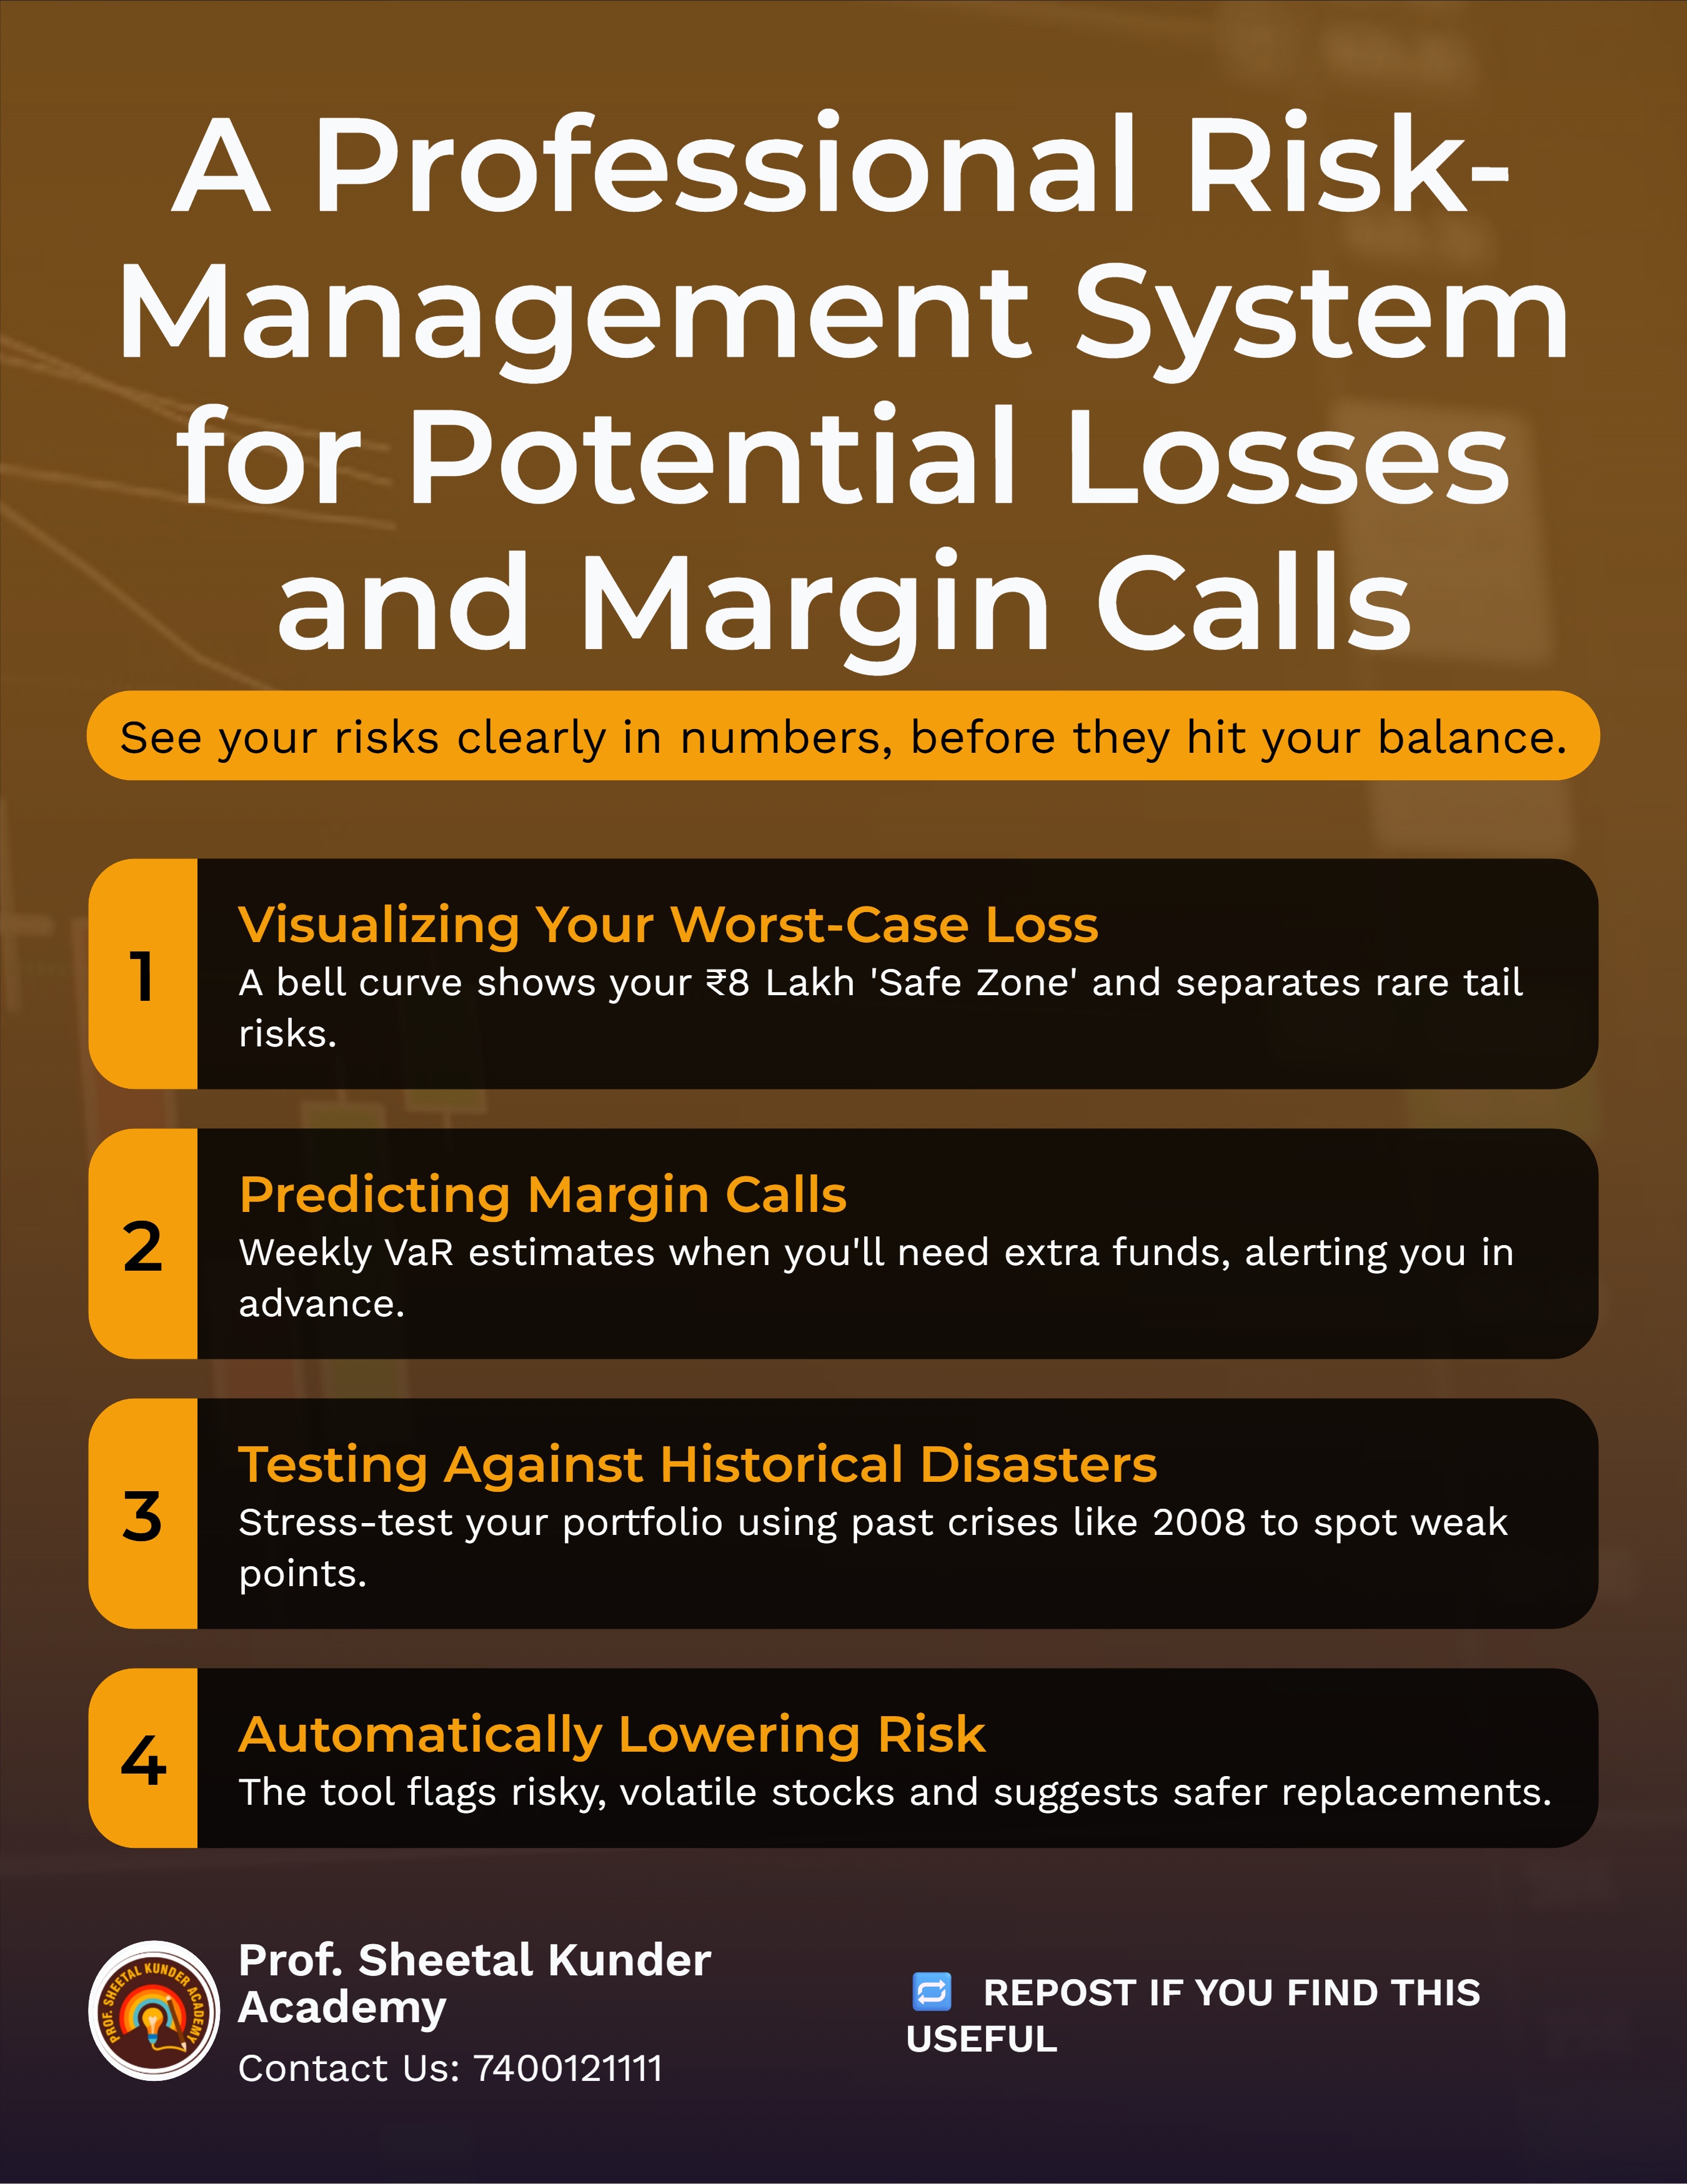
Pillar 10: The Trend's Vital Signs - Deep Dive into the ADX
The Core Question: “In technical analysis, the ADX is mainly used for which of the following purposes?”
10.1 The "Strength" Misconception. The most common mistake students make in the Technical Analysis chapter is assuming that a rising ADX (Average Directional Index) means a rising stock price. The ADX is non-directional. If a stock is crashing from ₹1,000 to ₹200 in a straight line, the ADX will rise toward 50 or 60. Why? Because the downward trend is very strong.
10.2 Thresholds for the Analyst. When writing a research report, you use ADX to categorise the market environment:
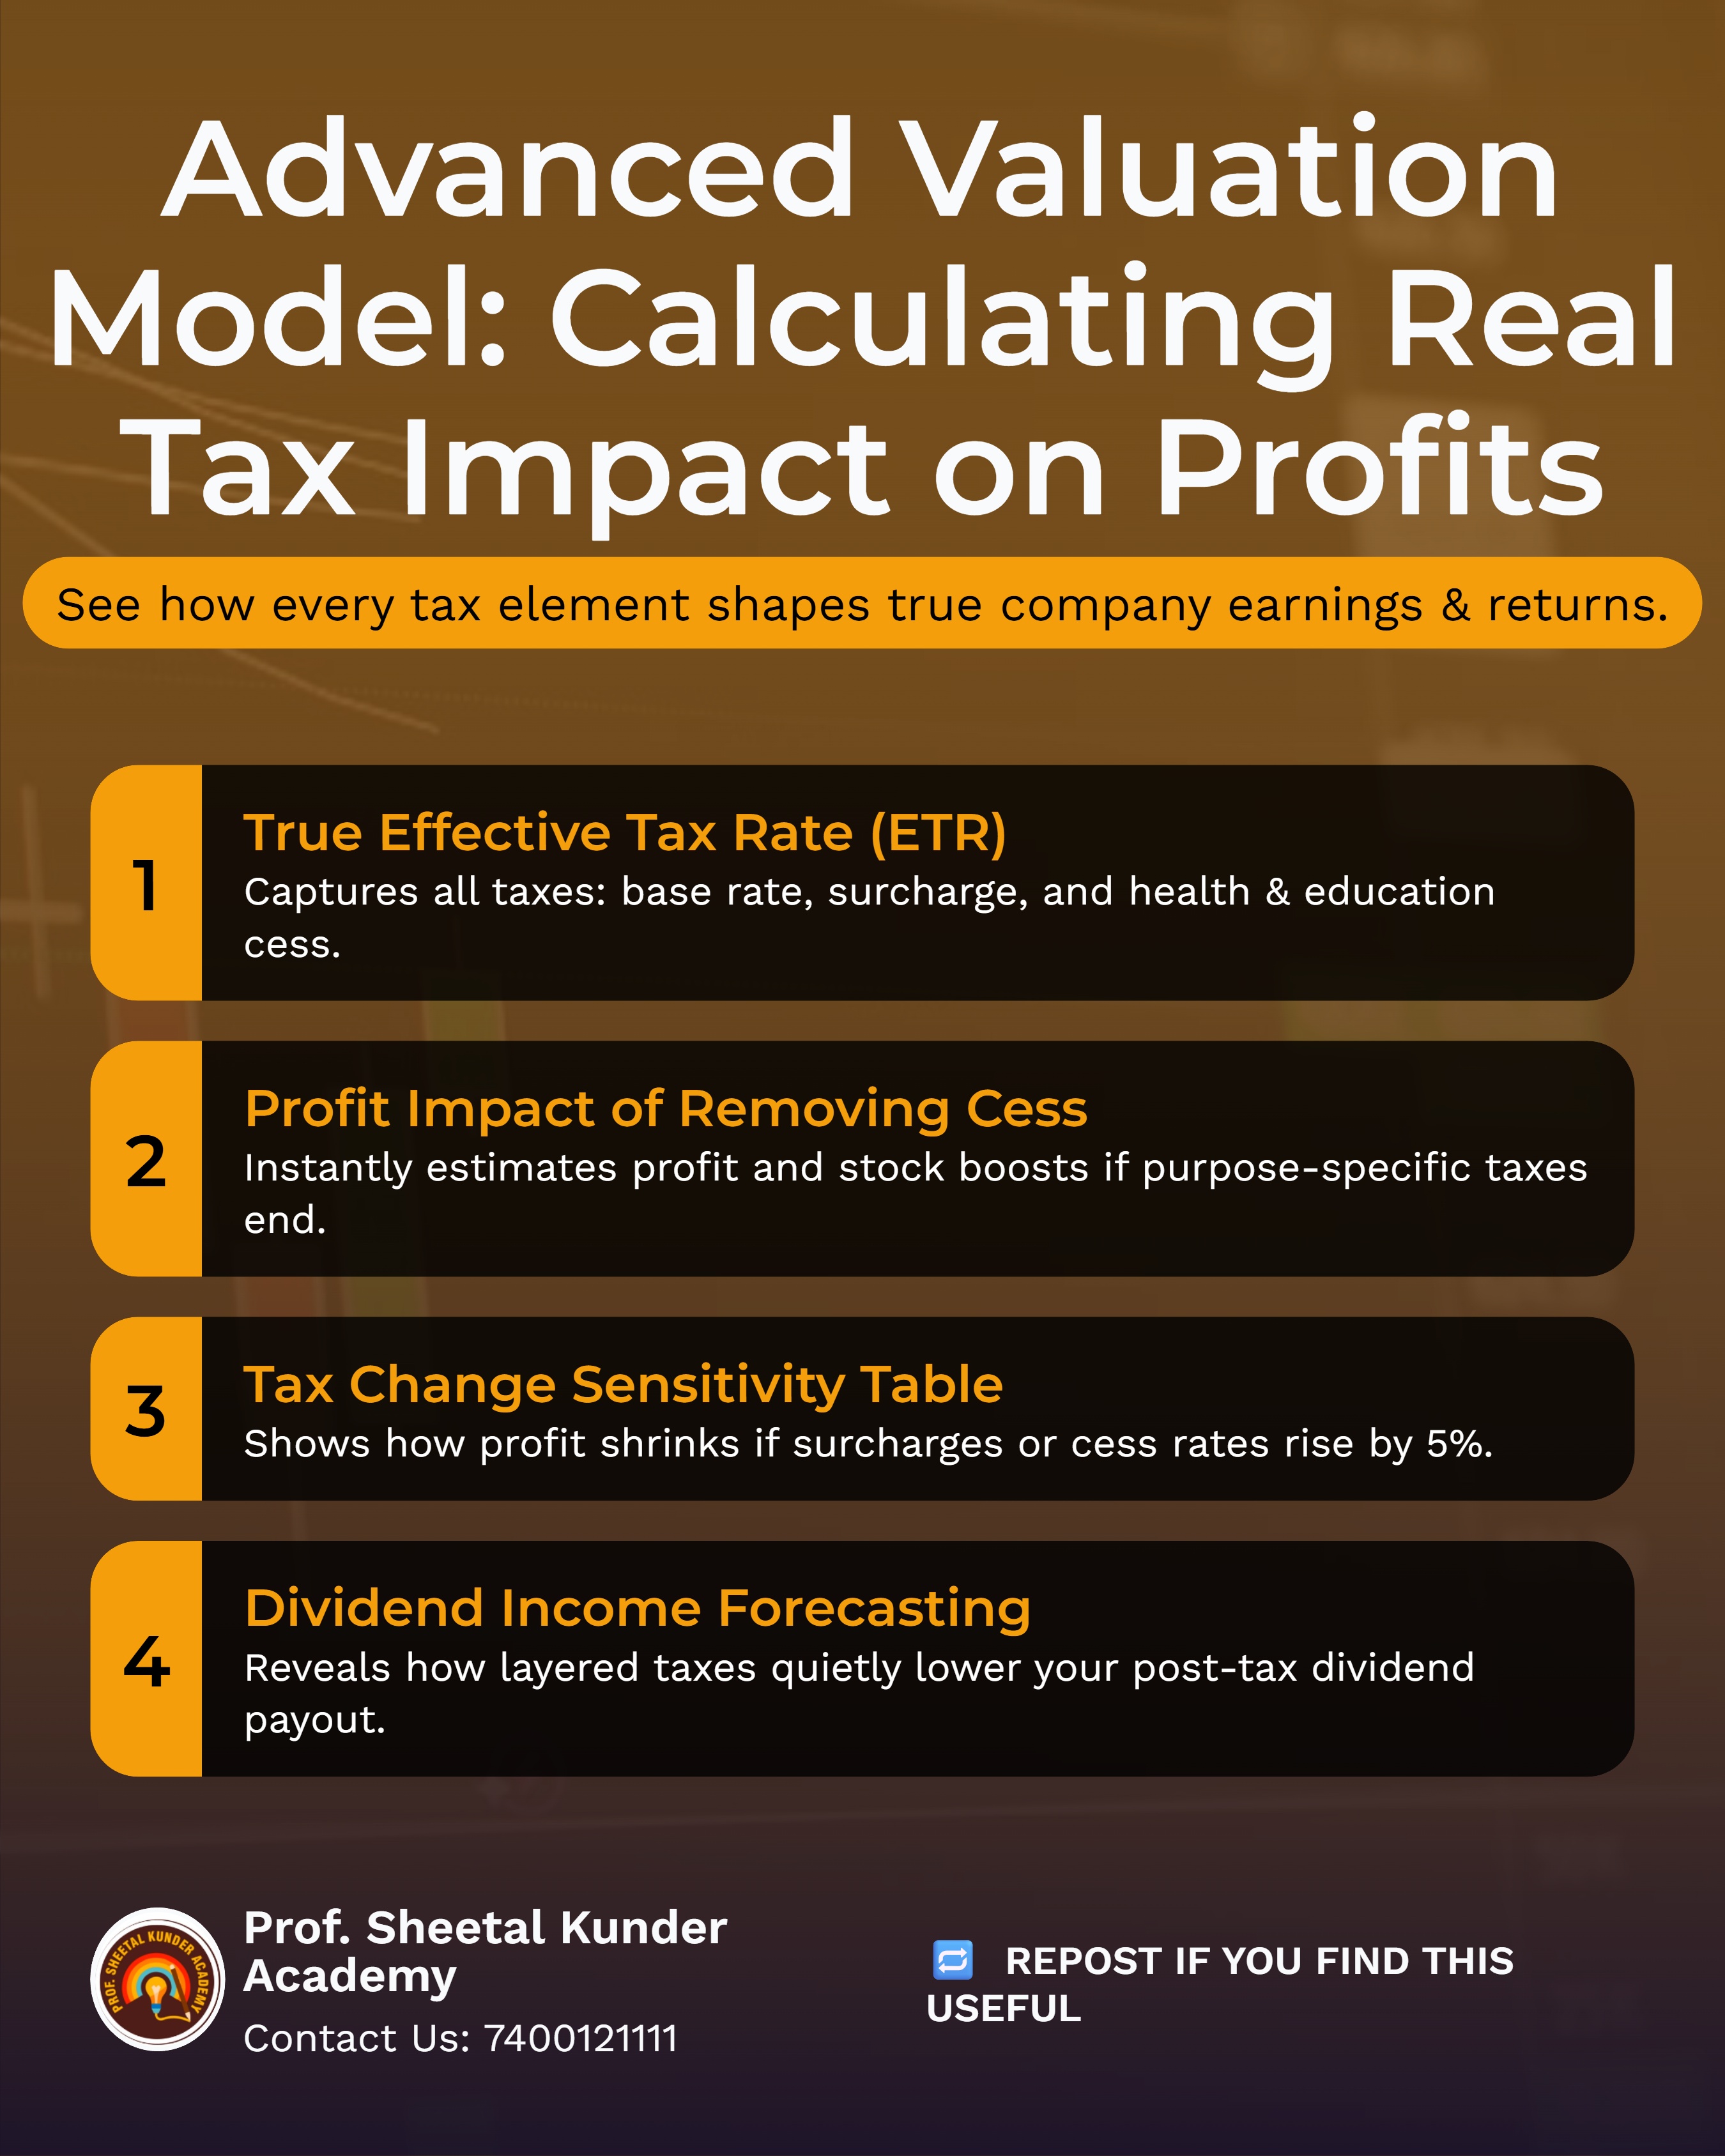
Pillar 11: The Taxman’s Rules - Surcharge vs. Cess
The Core Question: “Which statement correctly explains the difference between Surcharge and Cess in taxation?”
11.1 The Surcharge: The "Wealth Tax" In India, the Surcharge is a tax levied on the amount of income tax itself, not on the total income. It is a "progressive" tax intended to ensure that high-income earners contribute more.
Pillar 12: The 20-Mark Hurdle - Mastering Case Studies.
The 2026 NISM XV exam allocates 20% of the marks to five case studies. You cannot pass without mastering these.
12.1 The Anatomy of a NISM XV Case Study: A typical case study will provide:
Clearing the NISM Series XV in 2026 is more than a regulatory requirement; it is a "rite of passage" into the elite world of institutional finance. As we have explored across these 12 pillars, the difference between a mediocre analyst and a master researcher lies in Integration.
You have seen how a Support Level breach (Technical) can be confirmed by an Asset-to-Equity shift (Fundamental), and how both can be undermined by a Behavioural Bias like the Herd Mentality. In the modern market, these concepts do not exist in silos. Your success on the exam - and in your career - depends on your ability to see the "connective tissue" between these variables.
As you move into your final week of preparation, remember these three "Golden Rules" for the 2026 exam hall:
The journey to becoming a certified Research Analyst is rigorous, but the rewards - the ability to decode market mysteries and influence capital flow - are unparalleled. Master these 12 pillars, trust your simple physical calculator, and step into the exam centre with the confidence of a professional who has truly mastered their craft.
The market is a complex machine. Now, you have the manual.

{{AUTHOR}}
SEBI® Research Analyst. Registration No. INH000013800 M.Com, M.Phil, B.Ed, PGDFM, Teaching Diploma (in Accounting & Finance) from Cambridge International Examination, UK. Various NISM Certification Holders. Ex-BSE Institute Faculty. 18 years of extensive experience in Accounting & Finance. Faculty Development Programs and Management Development Programs at the PAN India level to create awareness about the emerging trends in the Indian Capital Market, and counsel hundreds of students in career choices in the finance area
 Launch your Graphy