There are no items in your cart
Add More
Add More
| Item Details | Price | ||
|---|---|---|---|

{{DATE}}
For risk managers, investment advisors, and NISM aspirants, knowing the precise impact of interest rate changes on a bond portfolio is non-negotiable. The tool for this quantification is Modified Duration. This metric translates the theoretical inverse relationship between yield and price into a predictive number, informing investors exactly how sensitive a bond’s value is to shifts in the market.
Modified Duration is essential because it measures the percentage change in bond price for a 1% change in the yield (YTM). This number is crucial for:
Risk Management: Portfolio managers use it to find out where interest rate risk is concentrated in a portfolio and where to hedge that risk (often using Interest Rate Derivatives).
Price Prediction: It allows you to anticipate exactly how much a bond's price will fall or rise if the YTM moves by a specific percentage.
Comparison: It makes it easy to compare the risk of different bonds—short-term vs. long-term, government vs. corporate, or high vs. low coupon bonds.
The computation of Modified Duration depends entirely on the YTM; hence, YTM is a critically important variable in this context.
Calculating Modified Duration manually requires several time-consuming steps, including first computing the Macaulay Duration. The Excel function MDURATION eliminates this complexity, providing an instant answer.
Steps to Calculate:
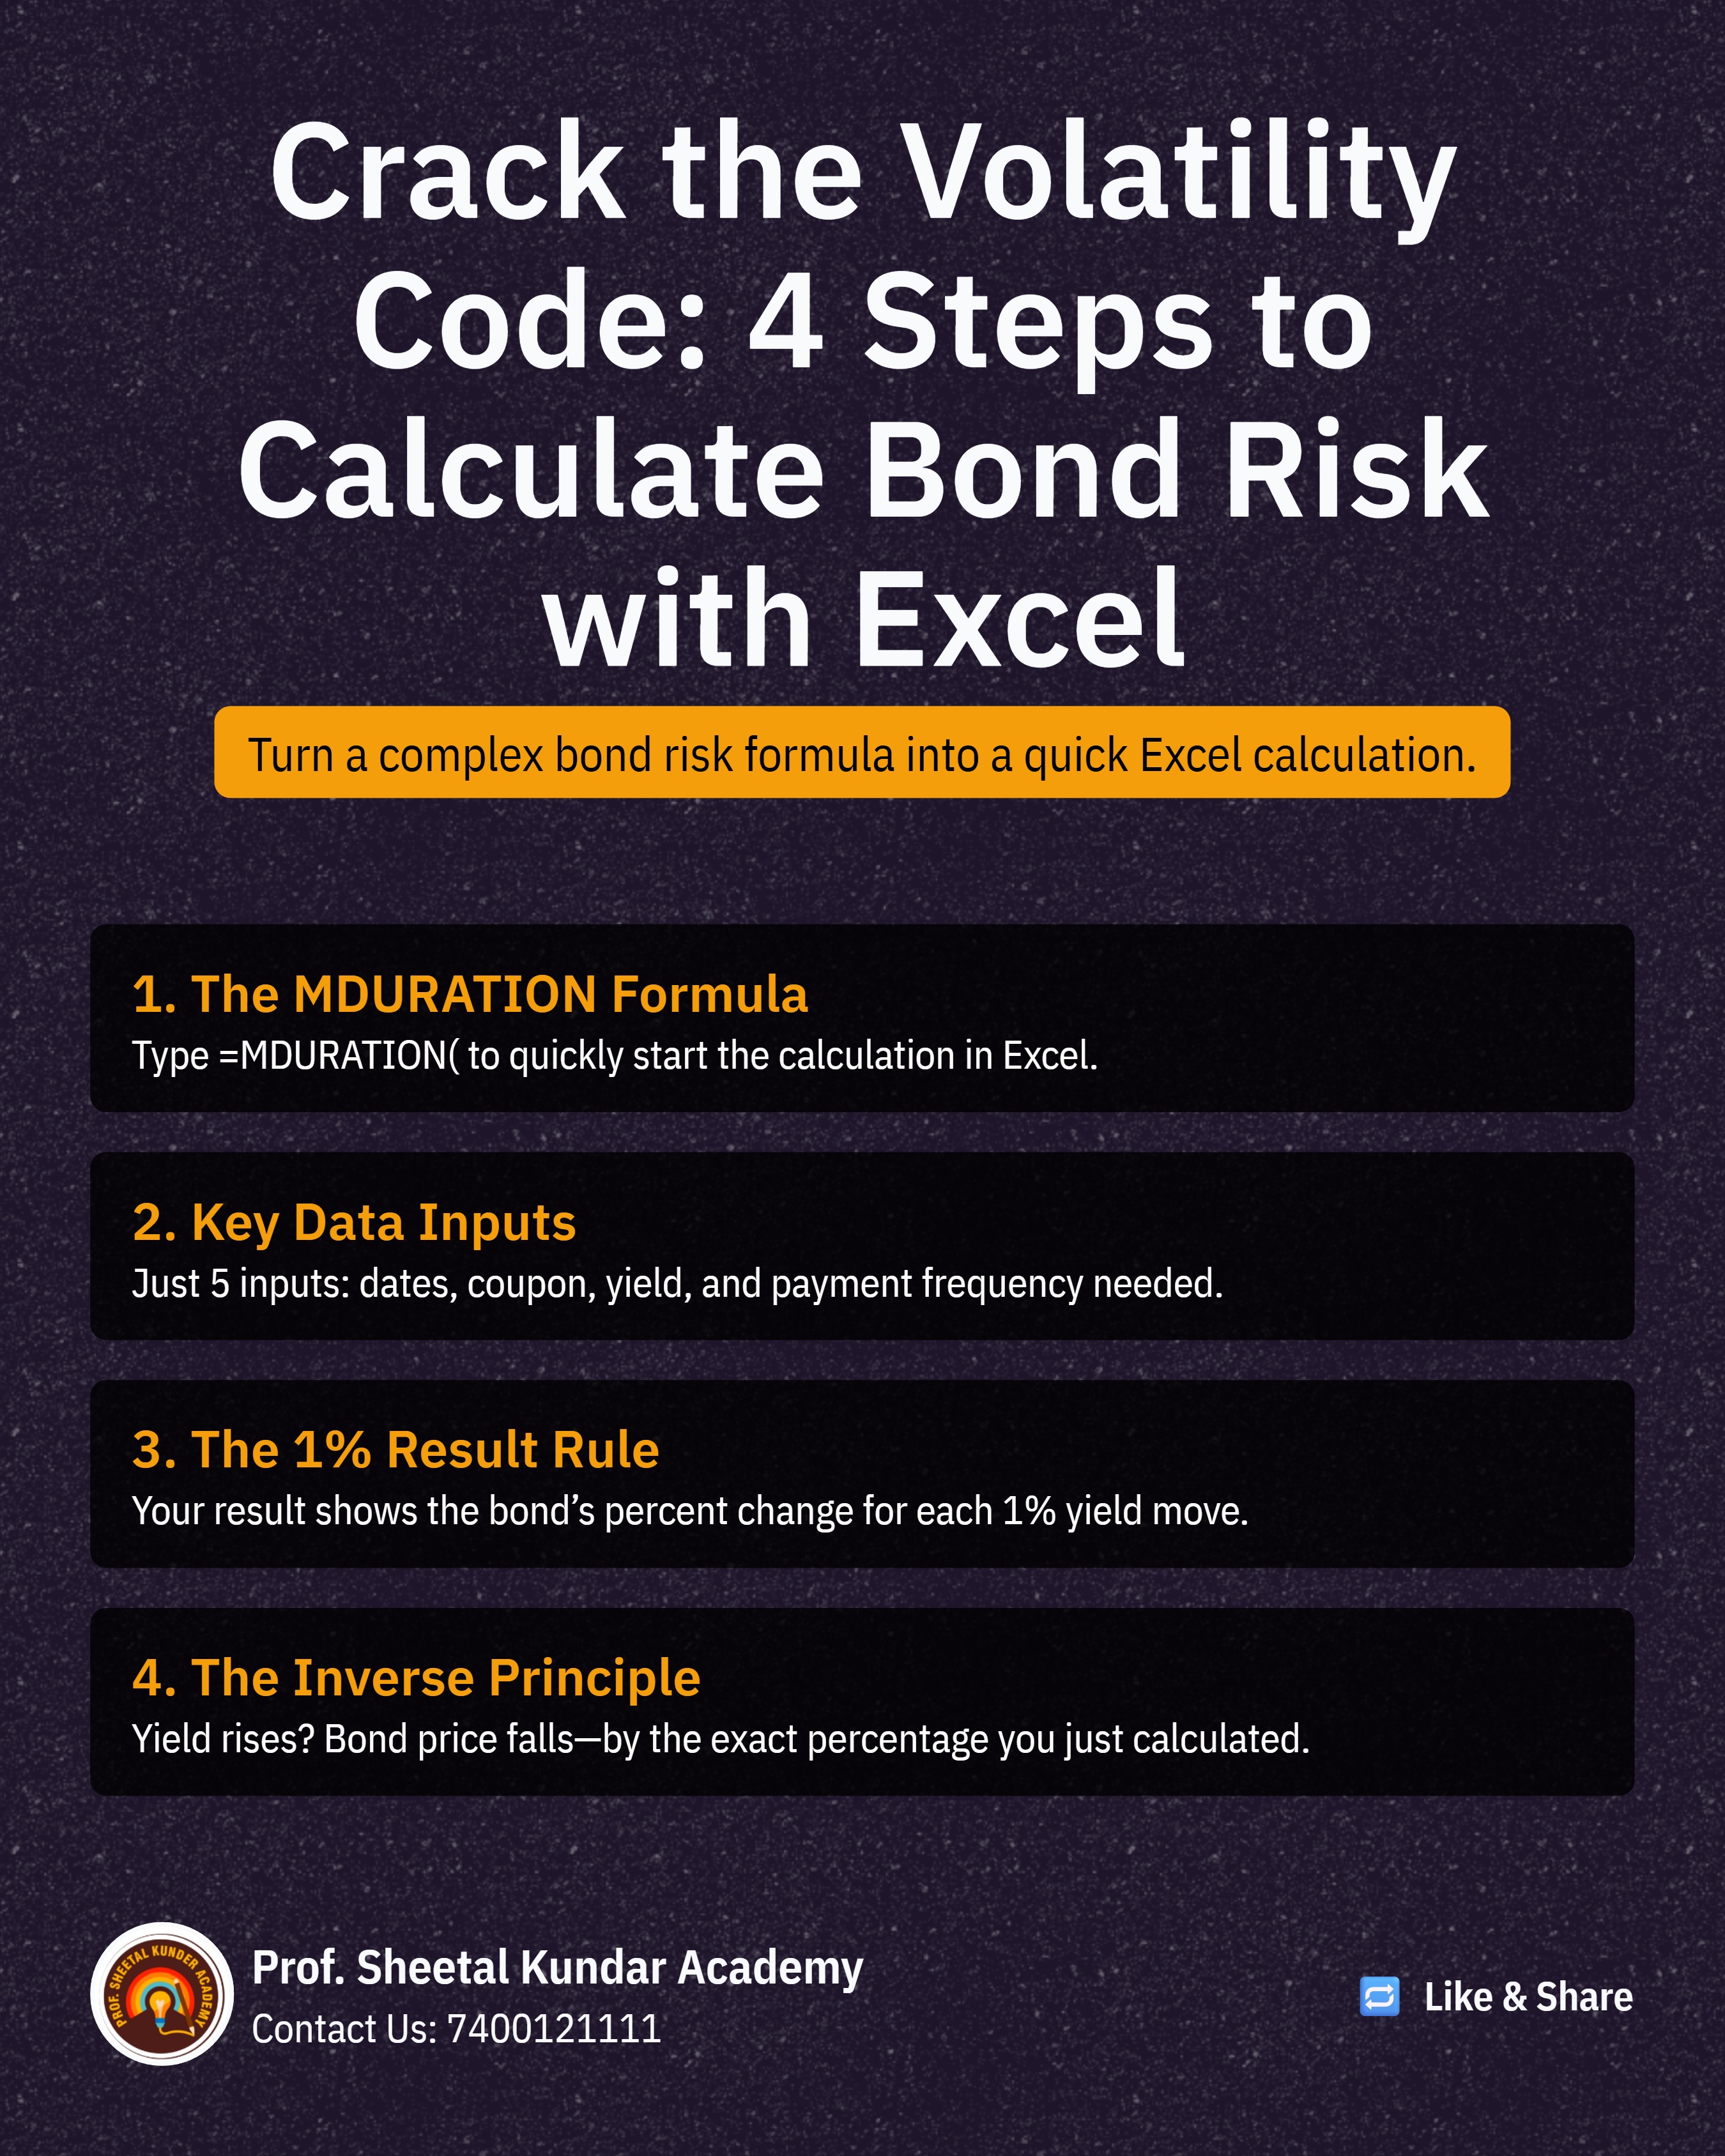
Use the MDURATION Function:
In an empty cell, type: =MDURATION(
The function will prompt you for the necessary fields.
Enter Key Fields: You will input the following required data points, all of which should be available from your bond's details:
Settlement Date (Purchase Date).
Maturity Date.
Coupon (Rate).
YIELD (YTM).
Frequency (Basis): The coupon frequency (e.g., 2 for semi-annual).
Result and Interpretation: Press Enter. The result (e.g., 0.92) means that a 1% increase in YTM will result in a 0.92% decrease in the bond's value. Conversely, a 1% decrease in YTM would lead to a 0.92% increase in the bond's value. Remember the inverse relationship is non-negotiable.

The true power of the MDURATION function lies in its ability to quickly verify the concepts underlying complex theoretical questions, which are frequent in NISM exams.
By simply changing variables in your Excel model, you can instantaneously confirm core bond theory:
Impact of Maturity: Increase the Maturity Date (e.g., from 2026 to 2036). You will observe that the Modified Duration figure increases significantly (e.g., from 0.92 to 7.05). This confirms the rule: Longer Maturity = Higher Duration/Risk.
Impact of Coupon Rate: Increase the Coupon Rate (e.g., from 8.5% to 10%). You will observe that the Modified Duration figure decreases. This confirms the rule: Higher Coupon = Lower Duration/Risk.
If you are ever confused or faced with a "twisted" question in the exam, you can quickly build a simple Excel example, change the relevant numbers (Maturity, YTM, or Coupon), and use the resulting Duration figure to confidently answer the theoretical question. This technique ensures that your understanding of the numbers dictates your answer, securing your success in the NISM examination.

{{AUTHOR}}
 Launch your Graphy